Crash test ratings provide crucial information for consumers, influencing vehicle purchasing decisions. They offer a standardized assessment of vehicle safety, highlighting the importance of understanding these ratings and how they’re calculated.
This guide delves into the world of crash test ratings, exploring the methodology behind these tests, the impact on consumer choices, and the evolution of safety standards across different regions. We’ll also examine how safety features relate to ratings and provide a visual representation of key findings.
Introduction to Crash Test Ratings
Crash test ratings are crucial assessments of vehicle safety. They evaluate how well a vehicle performs in controlled collisions, providing valuable insights into its ability to protect occupants during a crash. These ratings empower consumers to make informed decisions about vehicle safety, aiding in the selection of vehicles that offer the highest levels of protection.These assessments are not merely academic exercises; they have a tangible impact on real-world outcomes.
By identifying areas where vehicles perform poorly, crash test ratings facilitate the development of safer designs, ultimately contributing to a reduction in injuries and fatalities on the roads.
Crash Test Methodology
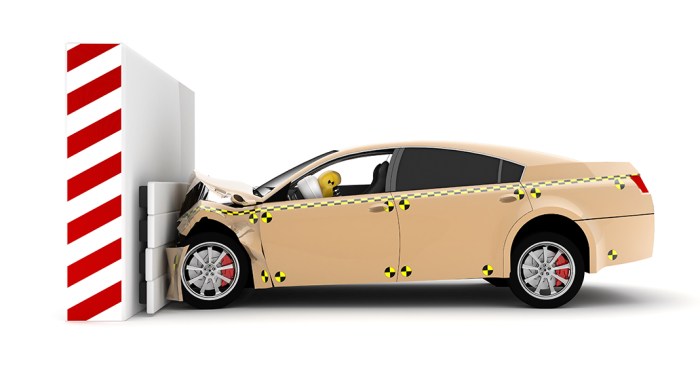
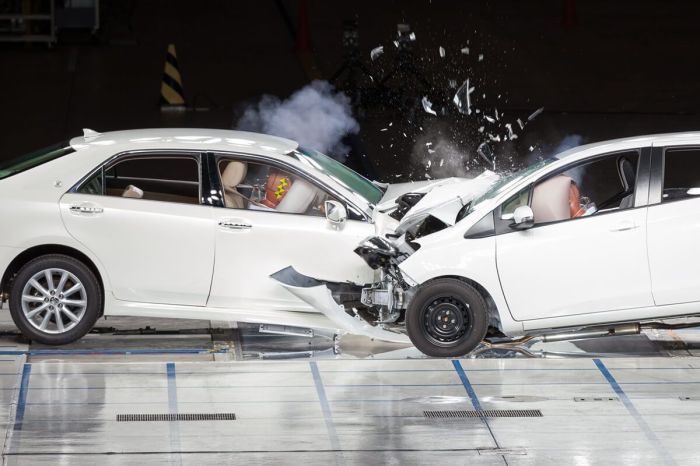
Crash test ratings are derived from standardized procedures, simulating various types of collisions. Different tests evaluate distinct aspects of vehicle safety. Front, side, and rear impacts are common types, each designed to assess the vehicle’s structural integrity and occupant protection.These tests use specialized equipment and standardized impact forces to recreate the forces experienced during a real-world collision. The severity of damage and the degree of occupant protection are meticulously measured and recorded.
Specific criteria, including intrusion into the passenger compartment, deformation of the vehicle structure, and the severity of injury to anthropomorphic test dummies (ATDs), are used to assess the vehicle’s safety performance.
Criteria for Assessment
Numerous criteria are employed to evaluate vehicle safety in crash tests. These criteria are designed to reflect the real-world risks and potential injuries associated with different types of collisions.
- Structural Integrity: This assesses how well the vehicle’s frame and components absorb and dissipate impact forces. High structural integrity is associated with minimal intrusion into the passenger compartment, reducing the risk of serious injuries to occupants.
- Occupant Protection: This aspect examines the safety features of the vehicle, such as seat belts, airbags, and other restraint systems. These features are evaluated for their effectiveness in minimizing the risk of injuries to occupants during a crash. Tests may involve varying occupant positions and types of collisions to assess the efficacy of these features.
- Injury Severity: This criterion measures the severity of injuries to anthropomorphic test dummies (ATDs) during a crash. Different injury types, such as head injuries, chest injuries, and leg injuries, are evaluated using standardized metrics.
History of Crash Testing Standards
The development of crash testing standards reflects a continuous evolution in understanding vehicle safety. Early standards were rudimentary, but as research and technology advanced, the standards have become increasingly sophisticated. The initial standards focused on basic structural integrity, but modern standards incorporate a broader range of factors, including occupant protection, injury severity, and the performance of advanced safety features.
Organizations Responsible for Crash Test Ratings
Several organizations are responsible for conducting and publishing crash test ratings. These organizations are independent entities, ensuring objectivity and impartiality in their assessments.
- National Highway Traffic Safety Administration (NHTSA): The NHTSA, a US government agency, conducts crash tests and publishes ratings for vehicles sold in the United States. Their data is often widely used and referenced.
- Insurance Institute for Highway Safety (IIHS): The IIHS, an independent organization, also conducts crash tests and publishes ratings. Their ratings are often considered highly influential, as they use a broader set of criteria and focus on aspects of safety that NHTSA might not cover.
Methodology of Crash Tests
Crash test methodologies are crucial for evaluating the safety performance of vehicles. These standardized procedures allow for consistent and comparable assessments across different models and manufacturers, enabling consumers to make informed purchasing decisions. The methodology encompasses a wide range of factors, from the specific impact scenarios to the types of sensors and dummies used.
Impact Scenarios
Crash tests simulate various real-world accident scenarios to evaluate vehicle structural integrity and occupant protection. These simulated impacts are meticulously designed to replicate different collision types, including frontal, side, and rollover impacts, each with specific objectives. For instance, frontal impacts assess the vehicle’s ability to absorb energy and prevent intrusion into the passenger compartment. Side impacts evaluate the protection afforded to occupants from impacts at the side of the vehicle.
Rollover impacts, while less frequent, are critical for assessing the vehicle’s stability and the protection of occupants during a rollover event. Each impact scenario is precisely controlled to ensure accurate and comparable results.
Dummies and Sensors
The use of anthropomorphic dummies and sophisticated sensors is integral to crash test procedures. These tools provide crucial data about the forces and stresses experienced by the occupants during the impact. Different types of dummies are used, each designed to simulate the physical characteristics and responses of different body types and sizes. For example, Hybrid III dummies are commonly employed in frontal and side impact tests due to their ability to model a range of occupant characteristics.
Various sensors are strategically placed on the dummies and within the vehicle structure to capture data such as acceleration, deceleration, and force distribution. These data points are analyzed to understand the potential injuries to occupants under various impact conditions.
Factors Influencing Results
Several factors significantly influence the outcome of crash tests. Vehicle design, encompassing the materials used and their arrangement, directly impacts the energy absorption and distribution during a collision. Material properties of the vehicle components, including the strength and stiffness of the metal used in the chassis, influence the vehicle’s ability to withstand the impact forces. Occupant position, including seatbelt usage and proper seating posture, is a critical element, directly affecting the distribution of forces and the likelihood of injury.
Safety Standards and Protocols
Various safety standards and protocols govern crash test procedures, ensuring consistency and reliability. These standards are developed and maintained by organizations such as the National Highway Traffic Safety Administration (NHTSA) in the United States and other international organizations. Adherence to these standards is mandatory for vehicle manufacturers to ensure their products meet safety requirements. These protocols dictate the specific procedures for conducting tests, including the types of impacts, the dummies used, and the data collected.
Impact of Crash Test Ratings on Consumers
Crash test ratings have become a crucial factor in consumer decision-making when purchasing vehicles. These ratings, reflecting the safety performance of a vehicle in controlled collisions, play a significant role in shaping consumer perceptions and influencing purchasing choices. The objective assessment of vehicle safety, provided by independent testing organizations, allows consumers to make informed decisions that prioritize their safety and well-being.Understanding how crash test ratings translate into consumer behavior is vital for manufacturers, regulators, and consumers alike.
The ratings provide a tangible metric for comparing different models, enabling consumers to identify vehicles that offer superior protection in the event of an accident. This transparency allows for more rational and data-driven choices, leading to potentially safer roads.
Role of Crash Test Ratings in Purchasing Decisions
Crash test ratings serve as a critical filter for consumers, narrowing down the options to vehicles deemed safer. A positive crash test rating can significantly increase a vehicle’s appeal to potential buyers, particularly those prioritizing safety. Consumers often utilize these ratings as a benchmark to evaluate different models, helping them make more informed choices aligned with their safety priorities.
Influence of Ratings on Vehicle Model Choice, Crash test ratings
Consumers actively seek out vehicles with high crash test scores, often viewing them as a crucial indicator of safety. This influence is particularly noticeable in segments of the market where safety is a primary concern, such as those with families or individuals living in areas with higher accident rates. Manufacturers often use the results of crash tests to improve their designs and develop vehicles that meet or exceed the safety standards set by these ratings.
Impact of Different Ratings on Sales and Market Share
Positive crash test ratings can lead to increased sales and a larger market share for a particular model. Conversely, negative ratings can result in decreased sales and reduced market share. For example, vehicles consistently performing well in crash tests often see increased demand and higher pricing compared to those with lower ratings. A manufacturer’s reputation for safety can be directly linked to consumer perception, making crash test ratings a powerful marketing tool.
Consumer Perception of Safety and Crash Test Ratings
Consumers often correlate high crash test ratings with a vehicle’s overall safety. This perceived safety translates into a higher perceived value, leading to a greater willingness to pay for vehicles with superior safety performance. This correlation is further reinforced by the widespread availability of crash test results through various online platforms and automotive publications, empowering consumers to make informed decisions.
The credibility of these ratings often influences public perception of a vehicle’s safety, potentially impacting a vehicle’s reputation and overall appeal.
Analyzing Different Vehicle Classes
Different vehicle classes exhibit varying crashworthiness characteristics. Understanding these differences is crucial for consumers to make informed decisions when selecting a vehicle. Factors like vehicle size, structure, and intended use contribute significantly to the crash test performance of various types.
Crash Test Ratings Across Vehicle Classes
Comparative crash test ratings offer valuable insights into the safety performance of different vehicle types. This analysis provides a snapshot of how various vehicle classes fare in standardized crash tests.
| Vehicle Type | Rating Agency | Frontal Impact Score | Side Impact Score |
|---|---|---|---|
| Sedan | IIHS | Good | Acceptable |
| SUV (Small) | IIHS | Marginal | Poor |
| SUV (Large) | IIHS | Good | Good |
| Pickup Truck (Small) | IIHS | Poor | Marginal |
| Pickup Truck (Large) | IIHS | Marginal | Poor |
| Minivan | IIHS | Good | Acceptable |
The table above presents a simplified comparison. Actual scores and ratings may vary depending on the specific model year and make/model of the vehicle. Different rating agencies (e.g., NHTSA, IIHS) may employ different testing protocols, which can influence the results.
Factors Influencing Crashworthiness
Various factors contribute to the differing crash test results across vehicle classes. Vehicle size, design features, and materials used all influence the outcome of a crash. Larger vehicles, for instance, often have stronger structures capable of absorbing more impact force, potentially resulting in better protection for occupants during a crash. Furthermore, advanced safety features, such as airbags and seatbelts, can also impact the severity of injuries sustained in a crash.
Considerations for Consumers
Consumers should carefully consider the crash test ratings when making vehicle purchasing decisions. By understanding the potential differences in crashworthiness between vehicle classes, consumers can select a vehicle that aligns with their needs and priorities. For instance, families with young children may prioritize vehicles with superior protection for occupants in the event of a collision, while those seeking greater utility may prioritize pickup trucks.
Safety Features and Crash Test Ratings
Crash test ratings are crucial for consumer vehicle selection, reflecting a vehicle’s performance in controlled collisions. These ratings, often influenced by various safety features, help consumers make informed decisions about vehicle safety. A strong correlation exists between the presence of advanced safety features and a vehicle’s overall crash test performance.
Relationship Between Safety Features and Ratings
The presence and design of safety features directly impact crash test outcomes. Well-integrated features, such as advanced airbags and robust structural components, can mitigate the severity of injuries during a collision. Conversely, a lack of these features or poorly designed systems can lead to more significant damage and potentially higher injury risks. This direct relationship is fundamental to understanding how safety features influence crash test ratings.
Specific Safety Features Affecting Ratings
Several key safety features demonstrably enhance crash test results. These features contribute to a vehicle’s ability to absorb impact forces and protect occupants.
- Advanced Airbags: Sophisticated airbag systems, including supplemental restraint systems (SRS) and various deployment strategies, can significantly reduce the impact forces on occupants. Multiple airbags, strategically positioned, offer protection to a wider range of potential impact zones.
- Reinforced Structural Components: Vehicles with reinforced frames, crumple zones, and high-strength steel components are better equipped to absorb the energy of a collision. These features are critical in reducing the forces transmitted to the occupants.
- Electronic Stability Control (ESC): ESC systems, which include anti-lock braking systems (ABS), prevent skids and maintain vehicle control during sudden maneuvers or accidents. This feature can improve the overall stability and control during collisions, reducing the severity of impact.
- Lane Departure Warning Systems: These systems can alert drivers to potential lane deviations, mitigating the risk of accidents. While not directly related to crash test scores, they play a significant role in preventing accidents, which translates into safer outcomes.
Influence of Feature Presence/Absence on Ratings
The presence or absence of particular safety features directly influences crash test ratings. Features like robust crumple zones, well-placed airbags, and advanced braking systems are consistently associated with higher ratings. Conversely, a vehicle lacking these features might receive lower scores, reflecting its reduced ability to protect occupants.
Correlation Between Safety Features and Ratings
| Safety Feature | Positive Impact on Ratings | Example |
|---|---|---|
| Advanced Airbags | Reduced injury severity, higher occupant protection scores | Multiple airbags, strategically positioned to cover various impact areas |
| Reinforced Structural Components | Improved energy absorption, reduced forces transmitted to occupants | High-strength steel, strategically placed crumple zones |
| Electronic Stability Control (ESC) | Enhanced vehicle stability during collisions, reduced severity of impact | ABS, traction control, and yaw-rate sensors |
| Anti-lock Braking System (ABS) | Improved braking performance in emergency situations, potentially reducing impact forces | Precise control of braking in slippery conditions, or during sudden stops |
Evolution of Crash Test Standards
Crash test standards have undergone significant evolution, reflecting advancements in engineering, accident analysis, and societal concerns for vehicle occupant safety. These standards are not static; they continuously adapt to incorporate new insights and technologies, leading to safer vehicles over time.The initial crash test standards were relatively basic, focusing on fundamental aspects of vehicle structure. Over time, however, these standards have become more sophisticated, encompassing a wider range of impact scenarios and injury criteria.
This evolution has significantly improved the safety performance of modern vehicles, making them better equipped to protect occupants during collisions.
Historical Changes in Crash Test Standards
Early crash test standards were often limited in scope and lacked the rigorous scientific foundation of modern methods. These earlier tests frequently involved simplified impact scenarios, primarily focusing on frontal collisions. More recently, tests have expanded to encompass a broader spectrum of collision types, including side impacts, rollovers, and pedestrian safety assessments.
Reasons Behind Revisions and Improvements
Revisions to crash test standards are driven by several factors. First, advancements in accident reconstruction techniques provide a more detailed understanding of crash dynamics. Second, analysis of injury patterns and accident data allows for refinement of impact criteria and safety features. Third, technological progress in materials science and engineering permits the development of stronger and lighter vehicle structures.
Crash test ratings are a key factor in assessing a vehicle’s safety. However, DIY car repair, while potentially cost-effective, can significantly impact a vehicle’s structural integrity and therefore its safety ratings. Understanding the potential risks associated with DIY modifications is crucial when evaluating crash test scores for any vehicle. DIY car repair can be a great way to save money, but it’s essential to remember that it’s not a substitute for professional inspections and adhering to safety standards, ultimately influencing crash test ratings.
Finally, changing societal expectations and stricter government regulations further drive improvements in crash test standards.
Impact of New Technologies on Crash Test Standards
Technological advancements have played a crucial role in shaping the evolution of crash test standards. For instance, the rise of advanced materials like high-strength steel and composite materials has influenced the development of stronger and lighter vehicle structures. Similarly, advancements in sensor technology have allowed for more accurate measurement of impact forces and occupant kinematics, leading to more precise assessment of safety performance.
The emergence of sophisticated computer simulations also aids in the design and analysis of crash scenarios, further refining the test methods.
Timeline of Key Milestones in Crash Test Standards Development
- 1950s-1960s: Early development of rudimentary crash tests, focusing primarily on frontal impacts. The emphasis was on basic structural integrity rather than occupant safety.
- 1970s-1980s: Introduction of side impact tests and more comprehensive injury criteria. This period saw an increase in the complexity of crash test scenarios to better reflect real-world accident patterns.
- 1990s-2000s: Expanded testing to include rollover simulations and pedestrian safety assessments. The use of advanced materials and improved injury analysis techniques became integral to these standards.
- 2010s-Present: Focus on advanced driver-assistance systems (ADAS) and the integration of vehicle dynamics into crash testing. Tests are increasingly incorporating the role of human factors in accident scenarios, like driver error and distracted driving.
Global Crash Test Standards
Global harmonization of crash test standards is crucial for ensuring consistent safety assessments across different markets. Varying standards can lead to confusion for consumers and manufacturers, potentially hindering the development and adoption of safer vehicles. This section explores the complexities of global crash test standards, highlighting differences and challenges in achieving uniformity.
Comparison of Crash Test Standards
Different countries and regions employ various methodologies and criteria for assessing vehicle safety. These variations stem from historical development, cultural factors, and priorities specific to each region. The disparities extend to test procedures, impact scenarios, and the specific safety features evaluated. Understanding these differences is essential for a comprehensive grasp of global safety standards.
Variations in Methodologies and Criteria
Significant variations exist in the methodologies and criteria used in crash testing across nations. For instance, the types of impacts simulated, the severity of the impacts, and the specific safety features assessed can differ substantially. These variations influence the overall safety ratings and the resulting consumer perception of vehicle safety. For example, certain regions may prioritize frontal impacts while others focus on side impacts or rollover resistance.
This diversity reflects differing accident profiles and safety priorities.
Challenges in Achieving Global Standardization
Achieving global standardization in crash test ratings faces numerous challenges. Differences in regulatory frameworks, technical expertise, and financial resources pose significant hurdles. Moreover, differing accident profiles and safety priorities across regions further complicate the process of creating a universally accepted standard. Negotiations between countries often involve compromises and concessions to reach consensus, making a unified approach a complex and time-consuming process.
Table of Crash Test Standards and Organizations
| Country/Region | Crash Test Standard | Testing Organization |
|---|---|---|
| United States | NHTSA (National Highway Traffic Safety Administration) | NHTSA |
| European Union | Euro NCAP (European New Car Assessment Programme) | Euro NCAP |
| Japan | JNCAP (Japan New Car Assessment Program) | JNCAP |
| Australia | ANCAP (Australasian New Car Assessment Program) | ANCAP |
| China | C-NCAP (China New Car Assessment Program) | C-NCAP |
Note: This table provides a snapshot of major standards; other regional variations exist.
Interpreting Crash Test Results
Understanding crash test results is crucial for informed purchasing decisions. These results, often presented in a numerical or visual format, provide insights into a vehicle’s safety performance. Interpreting these results requires careful attention to the specific metrics and ratings used.A comprehensive approach to interpreting crash test results involves recognizing the different types of tests, the scoring systems, and the specific safety features evaluated.
This process helps consumers assess a vehicle’s overall safety profile and compare it to other models.
Understanding Different Crash Test Categories
Various crash tests assess different aspects of a vehicle’s safety performance. Front, side, and rear impacts, along with rollover tests, all provide different data points. Each test category focuses on specific collision scenarios, allowing for a comprehensive evaluation of the vehicle’s response. For instance, a front impact test measures the protection offered to the driver and front-seat passenger during a frontal collision.
A side impact test evaluates the protection offered to occupants during a collision from the side. These separate evaluations provide a holistic view of the vehicle’s safety features.
Crash test ratings are crucial for car safety, but factors like the type of powertrain also play a role. For example, how do hybrid and electric vehicles compare in safety? Understanding the nuances of Hybrid vs electric technologies is vital for informed decision-making, ultimately impacting crash test results. Ultimately, a vehicle’s safety depends on a combination of factors, including the powertrain and the rigorous crash test procedures it passes.
Interpreting Scores and Ratings
Crash test results are typically presented using numerical scores or ratings, with higher scores generally indicating better performance. However, the specific meaning of these scores depends on the testing organization and the specific test category. For instance, a vehicle receiving a “Good” rating in the front impact test might receive a “Marginal” rating in the side impact test.
It’s important to consider all aspects of the ratings to form a complete picture of the vehicle’s safety. A score of 5 stars in one category doesn’t automatically translate to a 5-star overall rating.
Practical Advice for Using Crash Test Data
When using crash test data to inform purchasing decisions, consumers should consider the following factors. Firstly, focus on the vehicle’s performance in the categories most relevant to your driving needs and concerns. Secondly, compare results across different vehicle models within the same class. This allows for informed comparisons and helps you select a vehicle that best balances safety and other desired features.
Thirdly, remember that crash test results are just one piece of the puzzle. Consider other factors like safety features, reliability, and overall value when making a final decision.
Analyzing Different Aspects of Ratings
Crash test ratings often incorporate multiple aspects of vehicle performance, including occupant protection, structural integrity, and safety features. Understanding these components allows for a deeper interpretation of the results. For instance, occupant protection assesses how well the vehicle protects its occupants during a crash. Structural integrity evaluates the vehicle’s ability to withstand impact forces and maintain its structural integrity.
Safety features, like airbags and seat belts, are crucial in minimizing injuries. Examining these factors separately can offer valuable insights into the vehicle’s safety performance.
Using Ratings to Inform Purchasing Decisions
Crash test ratings provide valuable insights into a vehicle’s safety performance, allowing consumers to make more informed purchasing decisions. Consider the ratings as a starting point in your research. Combine the crash test results with other factors, such as price, fuel efficiency, and features, to arrive at a well-rounded assessment. This comprehensive approach ensures you select a vehicle that best meets your needs and priorities.
Visual Representation of Crash Test Data
Visual representation of crash test data is crucial for effective communication and understanding of safety performance. Clear and concise visuals allow for rapid comprehension of complex data, enabling both experts and the general public to quickly grasp the key findings and make informed decisions. This is particularly important in the automotive industry, where safety is paramount.Visual representations are not merely decorative elements; they are powerful tools for conveying insights into the results of rigorous crash testing.
Effective visualizations highlight key aspects of vehicle safety, facilitating comparisons across different models and classes, and allowing for a more intuitive understanding of the overall safety performance.
Types of Charts and Graphs
A variety of charts and graphs can effectively display crash test data. Bar charts are particularly useful for comparing the scores of different vehicles in various safety categories, such as frontal impact, side impact, or rollover resistance. Line graphs can show the evolution of crash test standards over time, revealing trends in safety improvements. Pie charts can highlight the distribution of scores within specific vehicle classes, providing a quick overview of the safety performance range.
Scatter plots can demonstrate correlations between specific design features and crash test results, allowing for a deeper understanding of how certain elements affect safety outcomes. Finally, infographics offer a comprehensive visual summary, combining various chart types and data points for a holistic view of the crash test findings.
Best Practices for Visual Representation
Employing best practices ensures clarity and accuracy in the visualization of crash test data. First, use clear and concise labels for all axes and data points to avoid confusion. Secondly, select a color scheme that is both aesthetically pleasing and easily distinguishable, avoiding overly complex or saturated colors that may hinder readability. Thirdly, ensure the visual scale is appropriate and accurately reflects the data range, avoiding distortion or misrepresentation.
Lastly, use a consistent visual style across different charts and graphs within a report to maintain a unified presentation. Incorporating interactive elements, such as tooltips or hover effects, can further enhance understanding and engagement with the data.
Example Infographic
Imagine an infographic that visually represents the crash test results for compact SUVs. The infographic uses a combination of bar charts and pie charts. The bar charts compare the average scores for frontal impact, side impact, and rollover resistance across different models. The pie charts illustrate the distribution of scores within each vehicle class, indicating the range of safety performance.
A color-coded key further enhances readability and clarity. For example, the infographic could display the following data:
| Vehicle Model | Frontal Impact Score | Side Impact Score | Rollover Resistance Score |
|---|---|---|---|
| Model A | 4.5 | 4.0 | 3.8 |
| Model B | 4.2 | 4.5 | 4.0 |
| Model C | 3.8 | 3.5 | 3.2 |
The infographic clearly displays the safety performance of each model, enabling quick comparisons and easy understanding.
Last Word
In conclusion, crash test ratings are an essential tool for informed vehicle purchasing. Understanding the methodologies, standards, and global variations is key to making a safe and informed choice. The ratings, alongside safety features, provide a valuable benchmark for assessing vehicle safety. The ongoing evolution of standards reflects a commitment to improving vehicle safety, and this comprehensive guide offers a detailed understanding of the subject.
Key Questions Answered
What are the different types of crash tests?
Common crash tests include frontal, side, and rollover impacts. Each type assesses different aspects of vehicle safety.
How do safety features influence crash test ratings?
Specific safety features, such as airbags and seatbelts, often correlate positively with higher crash test scores. The presence or absence of these features plays a role in the overall rating.
What are the key factors influencing crash test results?
Vehicle design, material properties, and occupant position significantly impact crash test results. Properly designed vehicles with high-strength materials, and safe occupant positioning, typically result in better ratings.
How can I interpret crash test scores?
Crash test scores are usually presented as ratings (e.g., Good, Acceptable, Poor). Interpreting the specific scores for different aspects of the crash test, such as frontal and side impacts, is crucial for informed decision-making.